
Representativity as a cornerstone
The distribution of the Accurat panel closely mirrors the distribution of the actual population in a country, although it is not a perfect match. Therefore, as in traditional market research, reweighting techniques are applied to correct for bias in the panel.
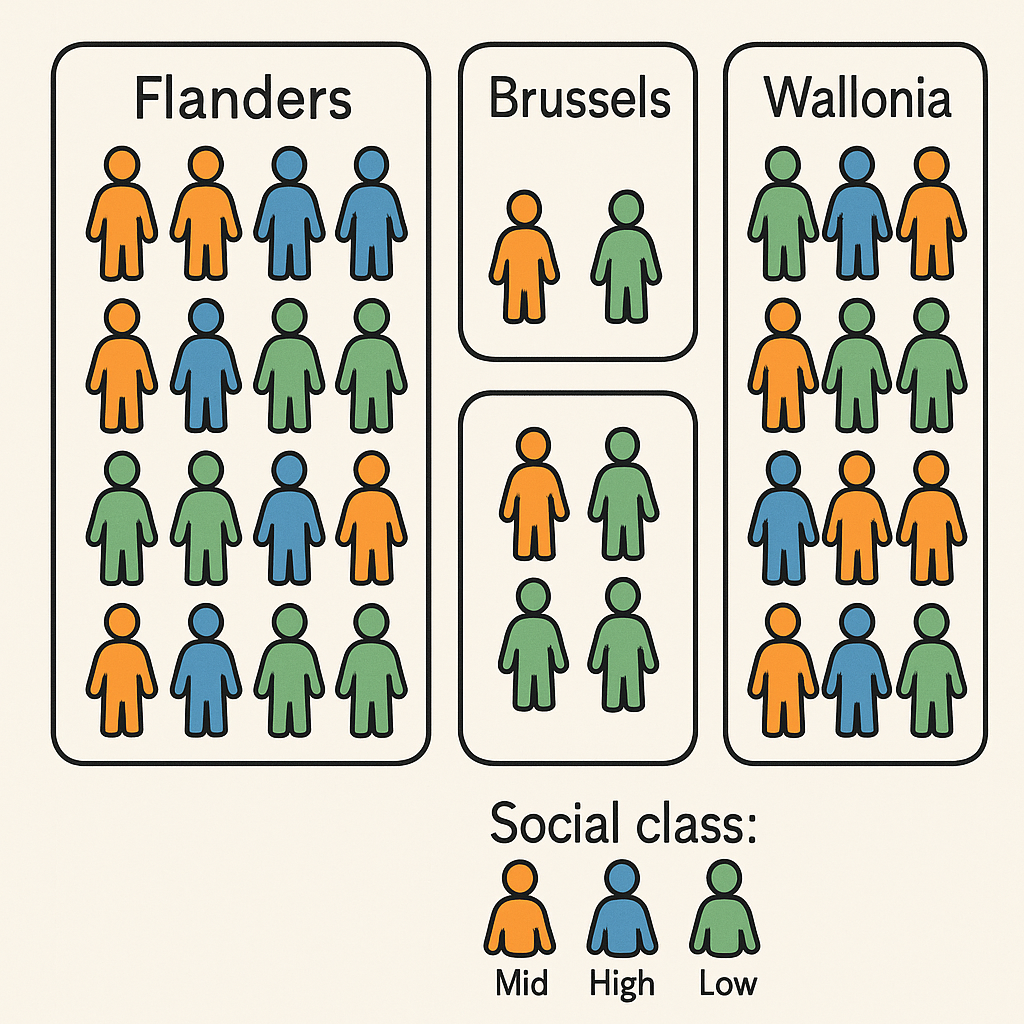
To achieve this, both geographical and socio-demographic bias are corrected using a combination of internal algorithms and external data sources. This includes proprietary models that infer user characteristics, alongside official census data used to calibrate and reweight the panel.
This approach ensures that panel metrics remain consistent and that the panel provides an accurate reflection of the overall population.